Monitoring Programs
Precipitation Monitoring
The District Monitors precipitation data at eight locations throughout the county. Six stations are District-owned Rainwise Inc. rain gauges, one with the Overton Texas A&M Agrilife Extension weather station, and the Henderson NOAA weather station. On a monthly basis, an average of the rain gauges provides approximate precipitation for the county. Collected precipitation data is available online and updated regularly.
Year To Date Precipitation
October 2022 – 33.74”
Average Year Cumulative for October: 37.11”
Drought Monitor
Moderate Drought
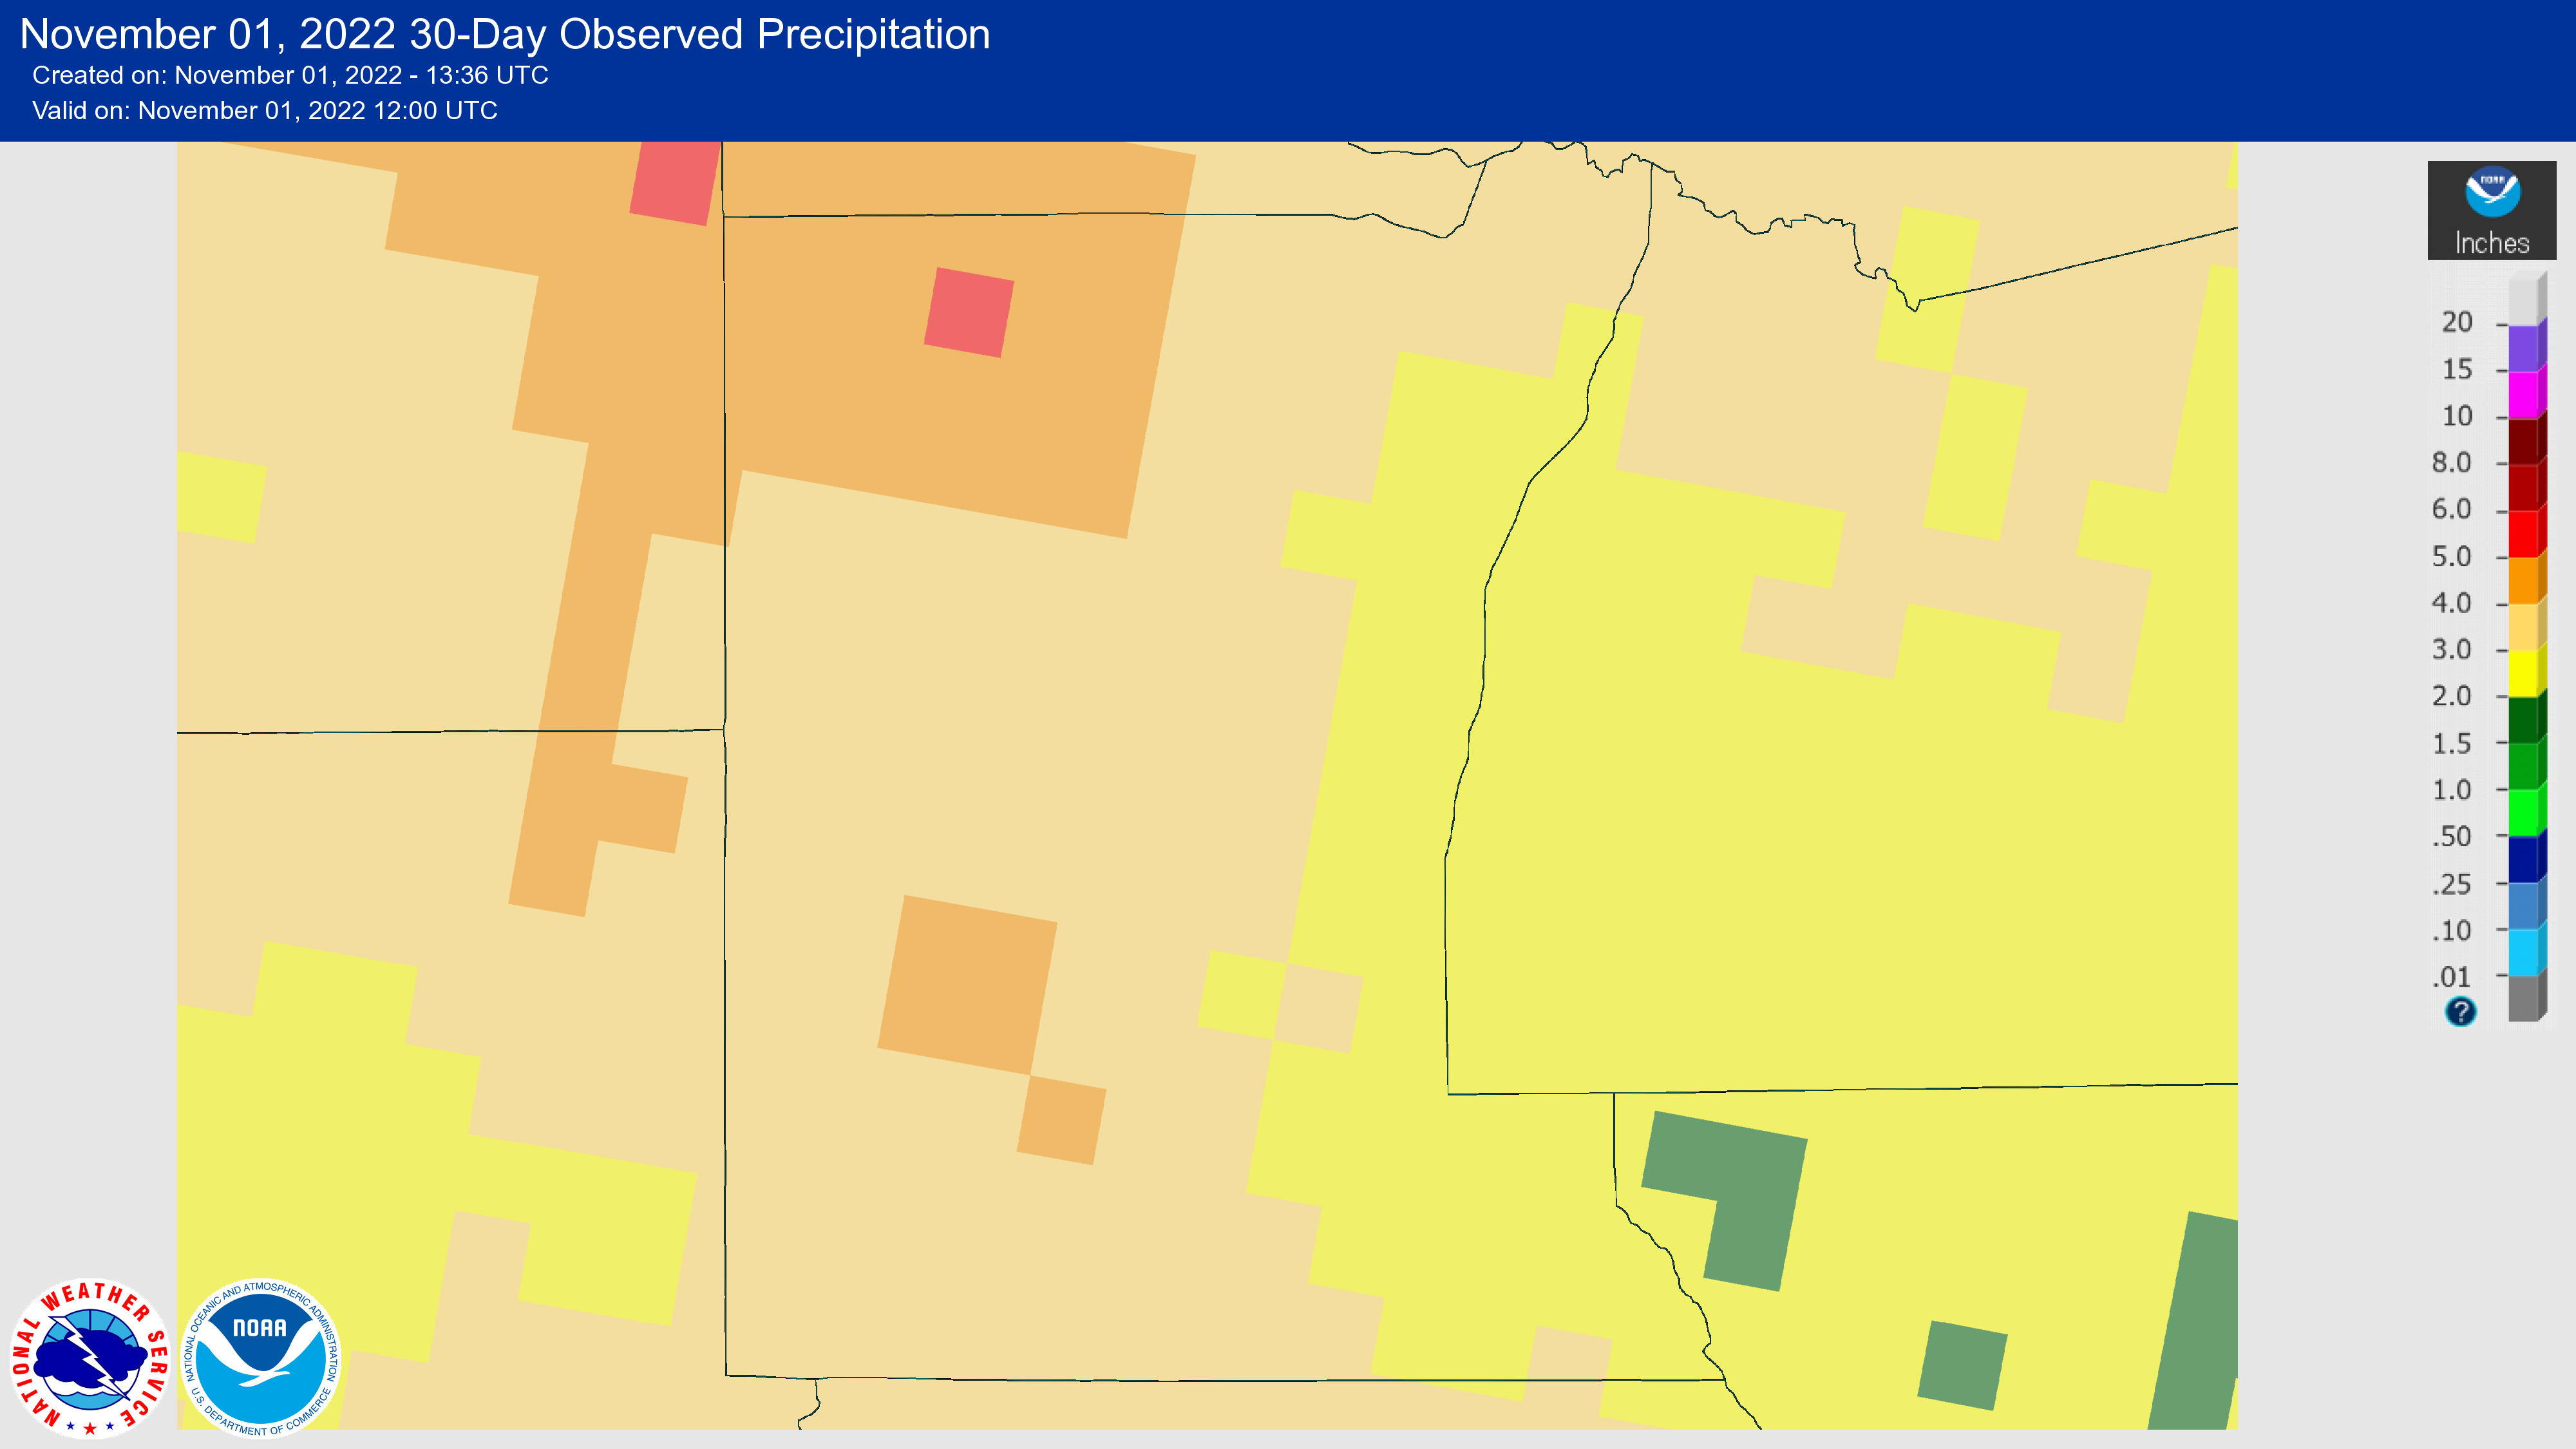
October 2022 Radar-Estimated & Rain Gauge Precipitation Data
Weather Resources
Texas Drought Monitor Map
Palmer Drought Severity Index Map
Soil Moisture Map
Texas Burn Bans Map
TWDB Precipitation Stations/TEXMESONET Map
National Weather Service Precipitation Estimates Map
NOAA Rusk County Weather Stations
TCEQ List of PWS Limiting Water Use to Avoid Shortages
TWDB Drought Resources Page
TWDB Flood Viewer
TWDB Rainfall Viewer
Aquifer Monitoring
The District monitors the static water level of numerous wells throughout Rusk County for the ability to monitor water levels and aquifer conditions over time. The collection of hydrogeologic data such as water levels is key to the District’s Mission and all resulting policies, management objectives and rules. Collection of this data along with groundwater production reports and estimates, accurate well location and completion data and other hydrogeologic properties assists the District to better understand and manage the groundwater resources. This collected data also assists the District in establishing Desired Future Conditions (DFC) of the aquifers, in the improvement of the Groundwater Availability Model (GAM), in monitoring current conditions of the aquifers, in making planning decisions, and in development of District Rules.
• Monthly: A network of monitor wells was established in 2006 to monitor aquifer fluctuations. The fluctuation graphs are available online and updated on a monthly basis. Graph available here
• Quarterly: A network of monitor wells was established in 2009 to monitor aquifer fluctuations. Quarterly water level fluctuations from the previous quarters can be seen here
• Real Time Monitoring: Beginning in October 2010, the District in cooperation with NOAA and the TWDB, installed four automatic water level recorders in monitor wells. Click on State Well Number Links below.
• TWDB Interactive Groundwater Data Viewer